User Guide
This guide explains how to use ClusterSight's features once you have at least one cluster connected.
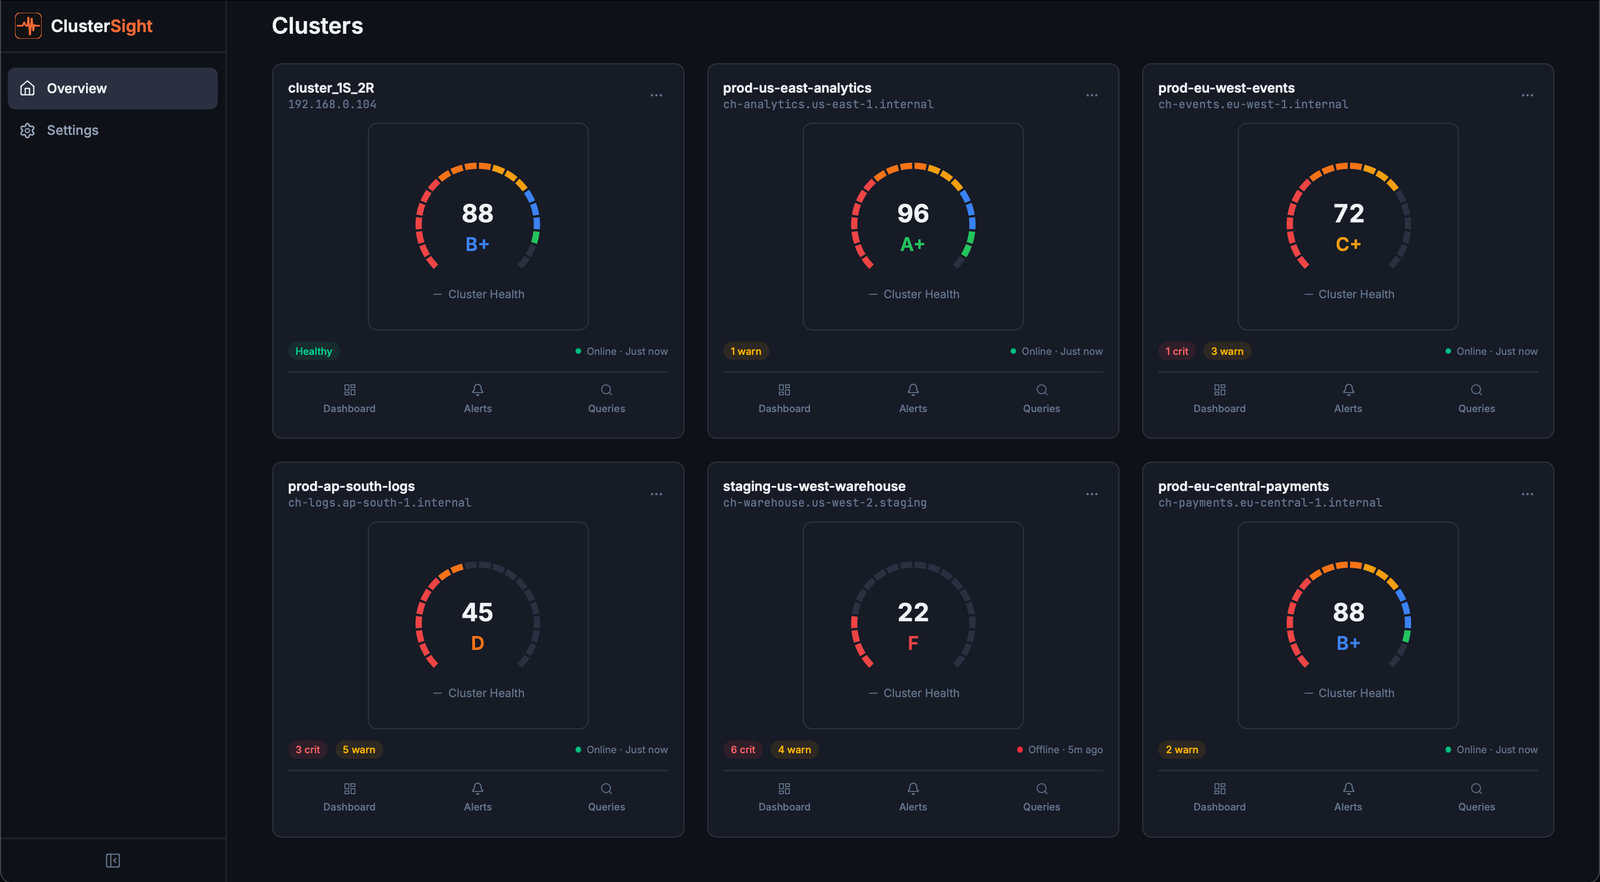
Cluster Overview Page
The Cluster Overview page (/clusters) is the home screen. It displays a card for each connected ClickHouse cluster.
Reading a cluster card
Each card shows:
| Field | Description |
|---|---|
| Health Score | 0–100 composite score with letter grade (A+ to F). See Health Score for details. |
| Status | Online — collecting data normally. Offline — ClusterSight cannot reach ClickHouse. |
| Active Alerts | Count of currently firing alerts across all severity levels. |
| Collector Status | Last successful collection timestamp. |
Online vs. Offline
- Online — The most recent collection cycle completed successfully. Panels show live data.
- Offline — The last connection attempt failed (wrong credentials, network issue, ClickHouse down). Dashboard panels may show stale or empty data.
Adding a second cluster
Click Add Cluster on the overview page. The onboarding wizard guides you through the connection form and connection test. Multiple clusters can be managed independently — each has its own dashboard, alerts, and health score.
Dashboard Panels
The dashboard for each cluster (/clusters/:id/dashboard) shows 11 monitoring panels. Each panel reads directly from ClickHouse system tables — no agents, no exporters.
health-score
What it shows: The cluster's composite health score (0–100) and letter grade.
Healthy: Score ≥ 90 (grade A or A+), all components green.
Unhealthy: Score < 60 (grade C- or below), one or more components degraded. See Health Score for the full breakdown.
Action: Identify which component is pulling the score down (shown in the gauge's component breakdown), then investigate the corresponding panel.
replication
What it shows: Replication lag (seconds) per replicated table, read-only status, and replica queue size.
Healthy: All delays at 0 seconds, no read-only replicas, queue size < 10.
Unhealthy: Delay > 10 seconds (warning), delay > 60 seconds (critical), any read-only replica.
Action: SYSTEM RESTART REPLICA <database>.<table> — restarts replication for a stuck replica.
merges
What it shows: Active merge operations, estimated completion time, and bytes merged per second.
Healthy: Active merge count < 5; no merges running for more than 15 minutes.
Unhealthy: Many concurrent merges or individual merges running > 15 minutes — indicates high write pressure or a large compaction operation.
Action: Review write throughput. Consider increasing background_pool_size or reducing insert frequency if merges are falling behind.
disk
What it shows: Used and free space per disk (path), with usage percentage.
Healthy: Disk usage < 60%.
Unhealthy: Usage > 80% (critical alert triggers). At > 90%, ClickHouse may stop accepting writes.
Action: Identify large tables — run the SQL fix command from the Disk Pressure alert, or set a shorter TTL on high-volume tables.
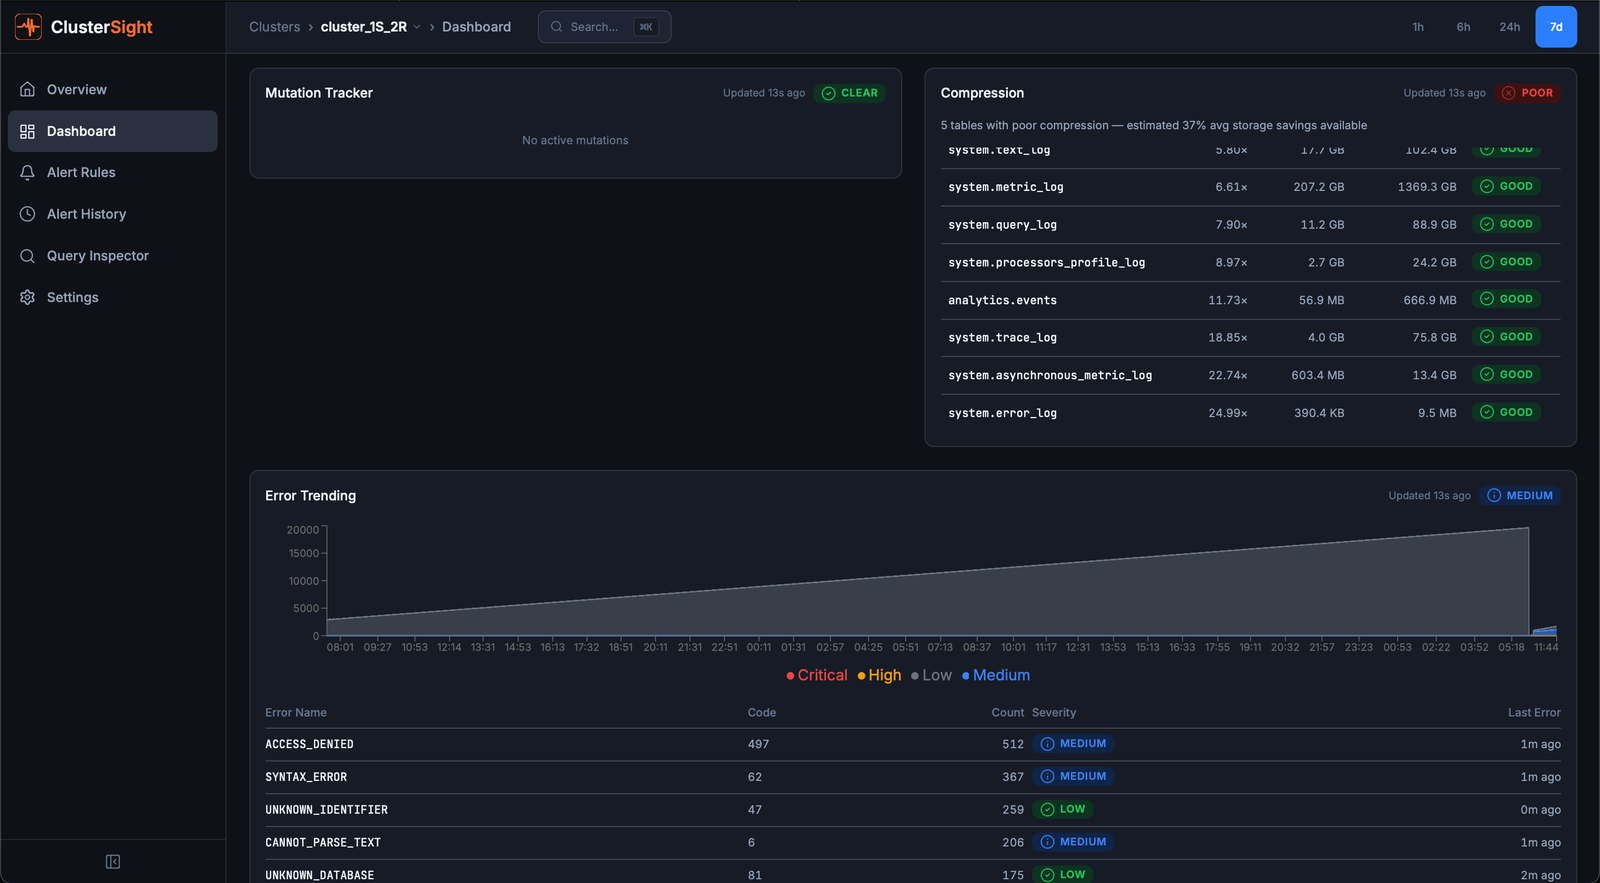
mutations
What it shows: Active ALTER UPDATE / ALTER DELETE mutations — operations that rewrite table data.
Healthy: No active mutations, or mutations completing within a few minutes.
Unhealthy: Stuck mutations (running for > 1 hour). Stuck mutations block further mutations on the same table and consume disk I/O.
Action: KILL MUTATION WHERE mutation_id = '<id>' AND database = '<db>' AND table = '<table>' — kills a stuck mutation.
broken-parts
What it shows: Count of detached or corrupted data parts in system.broken_parts.
Healthy: Count = 0.
Unhealthy: Any non-zero count — broken parts indicate data corruption or interrupted merges.
Action: Inspect with:
SELECT database, table, name, exception FROM system.broken_parts;Then restore per-table: SYSTEM RESTORE REPLICA <database>.<table>.
keeper
What it shows: ClickHouse Keeper (or ZooKeeper) connection health — whether ClusterSight can reach the Keeper ensemble.
Healthy: ONLINE — connection established.
Unhealthy: OFFLINE — Keeper unreachable. This affects replication and distributed DDL.
Action: Verify Keeper nodes are running. Check if the quorum is intact (majority of nodes must be available).
keeper-nodes
What it shows: TCP health status for each individual Keeper node, as seen by the ClickHouse instance.
Healthy: All nodes show status = 1 (reachable).
Unhealthy: Any node shows status = 0 (unreachable). A single failed node is tolerated if quorum remains; two or more failed nodes lose quorum.
Action: Investigate the unreachable node — restart with systemctl restart clickhouse-keeper if needed.
zookeeper
What it shows: ZooKeeper / Keeper session health metrics (ephemeral node count, session status).
Healthy: Ephemeral node count > 0, session active.
Unhealthy: Ephemeral node count = 0 — session may have expired or ZooKeeper is unreachable.
Action: Verify ZooKeeper quorum and check system.zookeeper for session details.
compression
What it shows: Per-table compression ratio (compressed / uncompressed bytes).
Healthy: Ratios of 0.2–0.5 are typical for columnar time-series data.
Unhealthy: Ratios close to 1.0 mean little compression is happening — usually indicates a poorly chosen ORDER BY key or inappropriate codec.
Action: Review the table's ORDER BY and CODEC settings. Low-cardinality columns earlier in the sort key dramatically improve compression.
errors
What it shows: Error event counts over time (from system.errors), trended as a time-series chart.
Healthy: Flat near zero.
Unhealthy: Spikes or sustained counts above background noise.
Action: Identify the error type:
SELECT name, code, value, last_error_time, last_error_message
FROM system.errors WHERE value > 0 ORDER BY value DESC;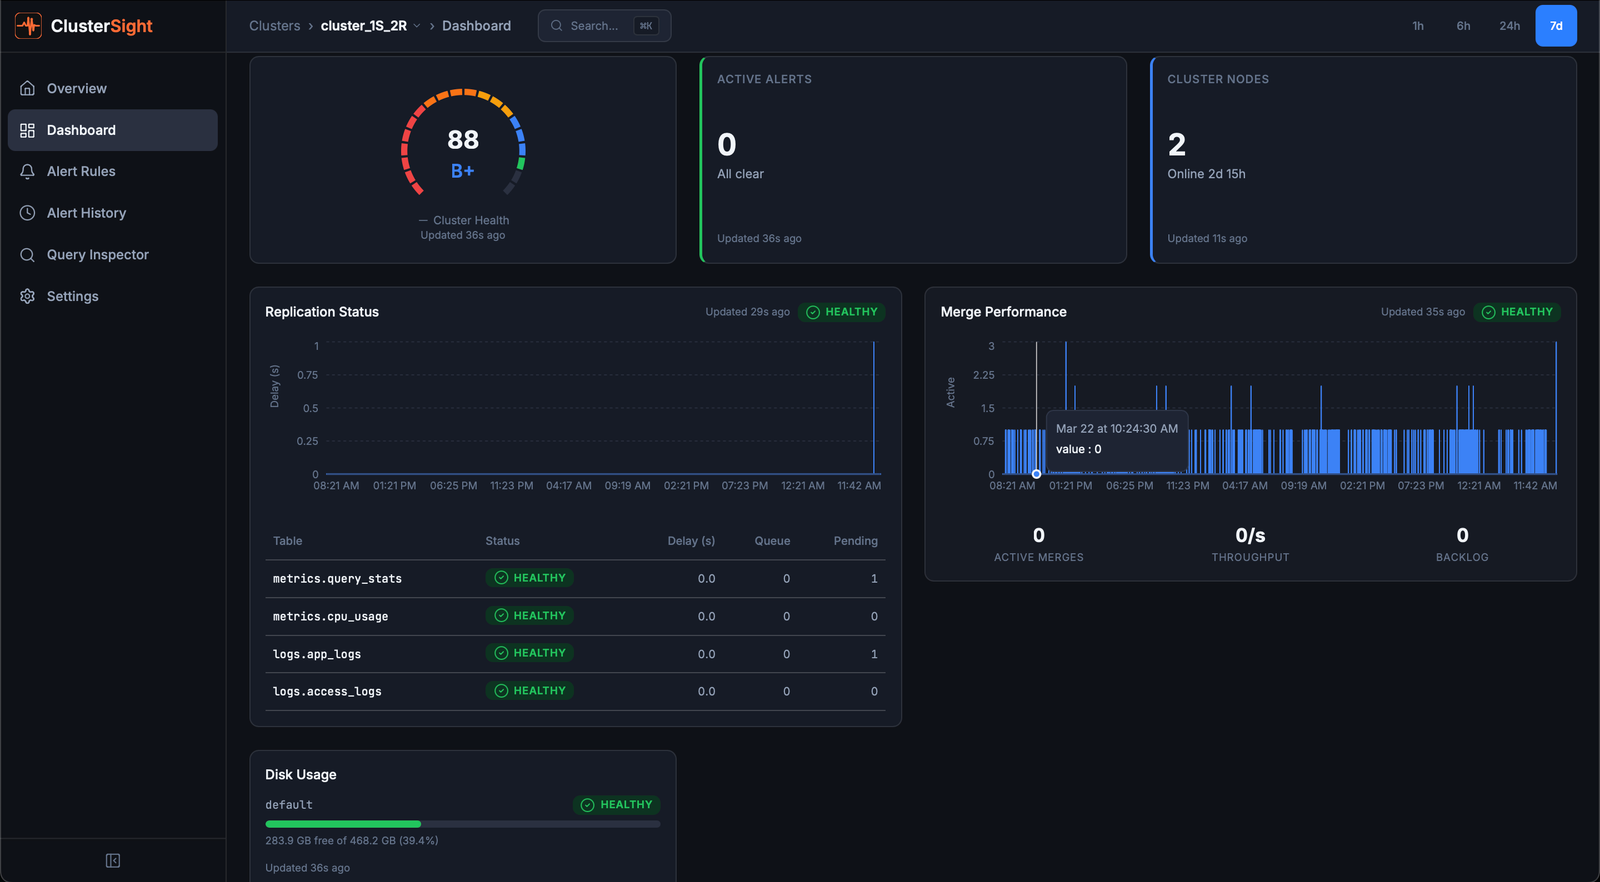
Health Score
The health score is a single 0–100 number summarising your cluster's overall condition, updated every collection cycle (default: 30 seconds).
Formula
overall = 0.30 × replication
        + 0.20 × storage
        + 0.20 × errors
        + 0.15 × infrastructure
        + 0.15 × queries
Components
| Component | Weight | What it measures |
|---|---|---|
| Replication | 30% | Replica delay, read-only status, queue size |
| Storage | 20% | Disk usage %, detached parts, active part count |
| Errors | 20% | Error event count in system.errors |
| Infrastructure | 15% | ZooKeeper/Keeper health, merge backlog |
| Queries | 15% | Stuck mutations (parts_to_do > 0) |
Critical cap
If any component scores ≤ 30, it cannot be inflated by other healthy components. This prevents a single critical issue (e.g., a read-only replica scoring 0) from being masked by everything else being healthy.
Grade thresholds
| Score | Grade | Score | Grade |
|---|---|---|---|
| ≥ 95 | A+ | ≥ 65 | C |
| ≥ 90 | A | ≥ 60 | C- |
| ≥ 85 | B+ | ≥ 50 | D+ |
| ≥ 80 | B | ≥ 40 | D |
| ≥ 75 | B- | < 40 | F |
| ≥ 70 | C+ |
What drives the score down
- Replication lag > 10 seconds → replication component drops below 80
- Read-only replica → replication component drops to 0 (critical cap applies)
- Disk > 80% → storage component drops to 50
- Detached parts > 0 → storage component loses 30 points
- Stuck mutation (age > 1 hour) → queries component drops by 40 points
- ZooKeeper unreachable → infrastructure loses 40 points
Alerts
The Alerts page (/clusters/:id/alerts) shows all currently active and historical alerts for a cluster.
Reading the alert list
Each alert row shows:
- Name — the rule that fired (e.g., "Disk Pressure")
- Severity —
warning(yellow) orcritical(red) - Status —
active,acknowledged, orresolved - Value — the metric value that triggered the alert
- Fix Command — a SQL or shell snippet to remediate the issue
Severity levels
| Severity | Meaning |
|---|---|
| warning | Degraded but not immediately dangerous. Investigate soon. |
| critical | Action required. The cluster may be impaired or data may be at risk. |
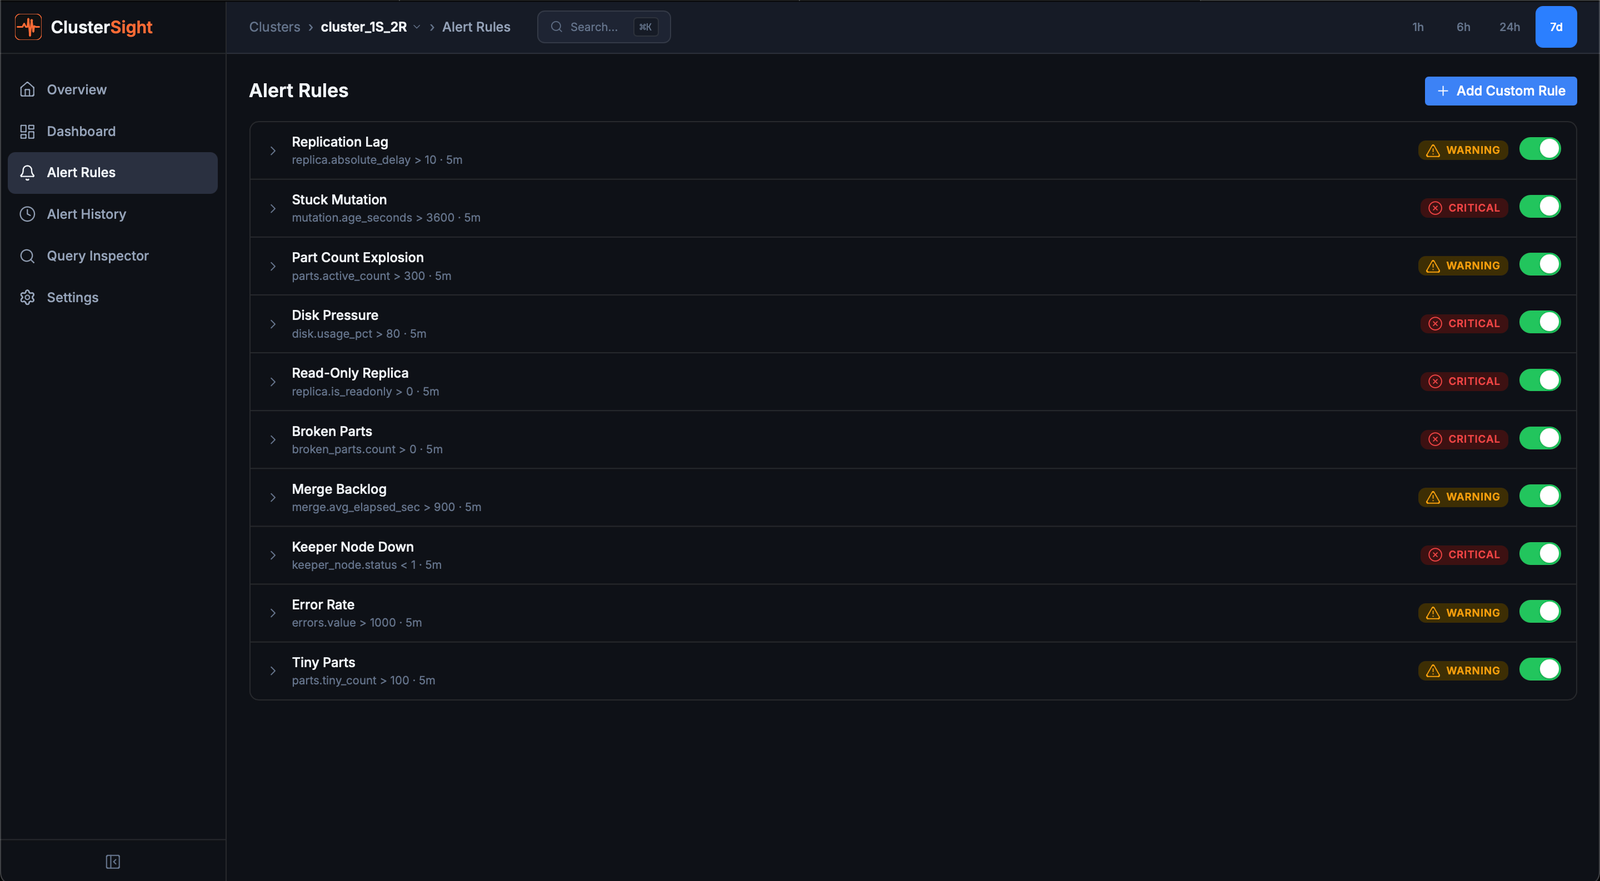
10 built-in alert rules
| Rule | Triggers when | Severity |
|---|---|---|
| Replication Lag | Replica delay > 10 seconds | warning |
| Stuck Mutation | Mutation running > 3600 seconds | critical |
| Part Count Explosion | Active parts > 300 for a table | warning |
| Disk Pressure | Disk usage > 80% | critical |
| Read-Only Replica | is_readonly flag set | critical |
| Broken Parts | Any broken/detached parts | critical |
| Merge Backlog | Average merge time > 900 seconds | warning |
| Keeper Node Down | Keeper node status < 1 | critical |
| Error Rate | Error event count > 1000 | warning |
| Tiny Parts | Tiny parts (< 1 MB) count > 100 | warning |
Fix commands
When an alert fires, a Fix Command button shows the SQL or shell command to remediate the issue. Click to copy the command to your clipboard, then run it against your ClickHouse cluster.
Managing alert thresholds
To adjust a built-in rule's threshold or severity, navigate to Alert Rules and edit the rule. You can also create custom rules for any metric key exposed by the collector.
Slack notifications
- Create a Slack incoming webhook in your Slack workspace.
- Navigate to Settings (
/settings) in ClusterSight. - Paste the webhook URL into the Slack Webhook URL field and click Save.
- Click Test Notification to verify delivery.
Alerts at critical severity trigger immediate Slack delivery. The notification includes the rule name, current value, cluster name, and a direct link to the alert in the dashboard.
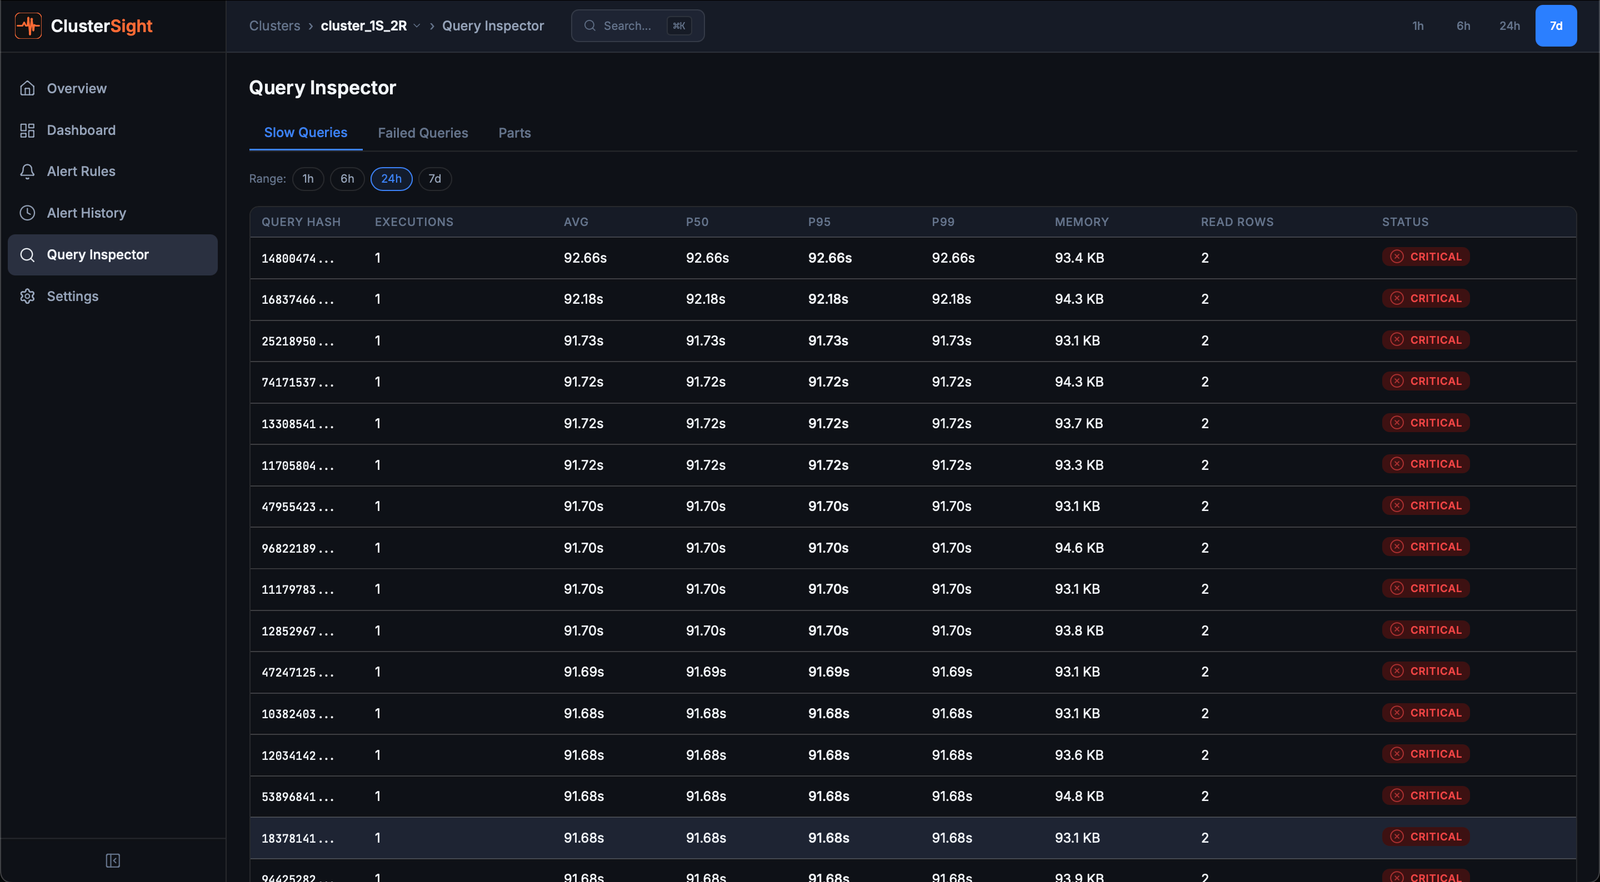
Query Inspector
The Query Inspector (/clusters/:id/queries) has three tabs for investigating query performance.
Slow Queries tab
Shows the slowest queries from system.query_log over a configurable time window.
- Sort by duration, memory, or rows read by clicking column headers
- Click any row to open a detail sheet with the full query text, explain plan, and resource breakdown
- EXPLAIN — the detail sheet automatically fetches
EXPLAINoutput for the selected query
Use slow queries analysis to identify:
- Queries scanning too many rows (missing index or full-table scans)
- High-memory queries that risk OOM
- Queries that run frequently but could be cached
Failed Queries tab
Shows queries that returned errors, grouped by error type and user. Useful for diagnosing:
- Permission errors (user missing GRANT)
- Syntax errors from application code
- Timeout patterns
Parts Distribution tab
Shows table parts size distribution — how many parts each table has and their size range. Use this to identify:
- Tables with too many tiny parts (insert pattern issue)
- Tables with abnormally large parts (merge not running)
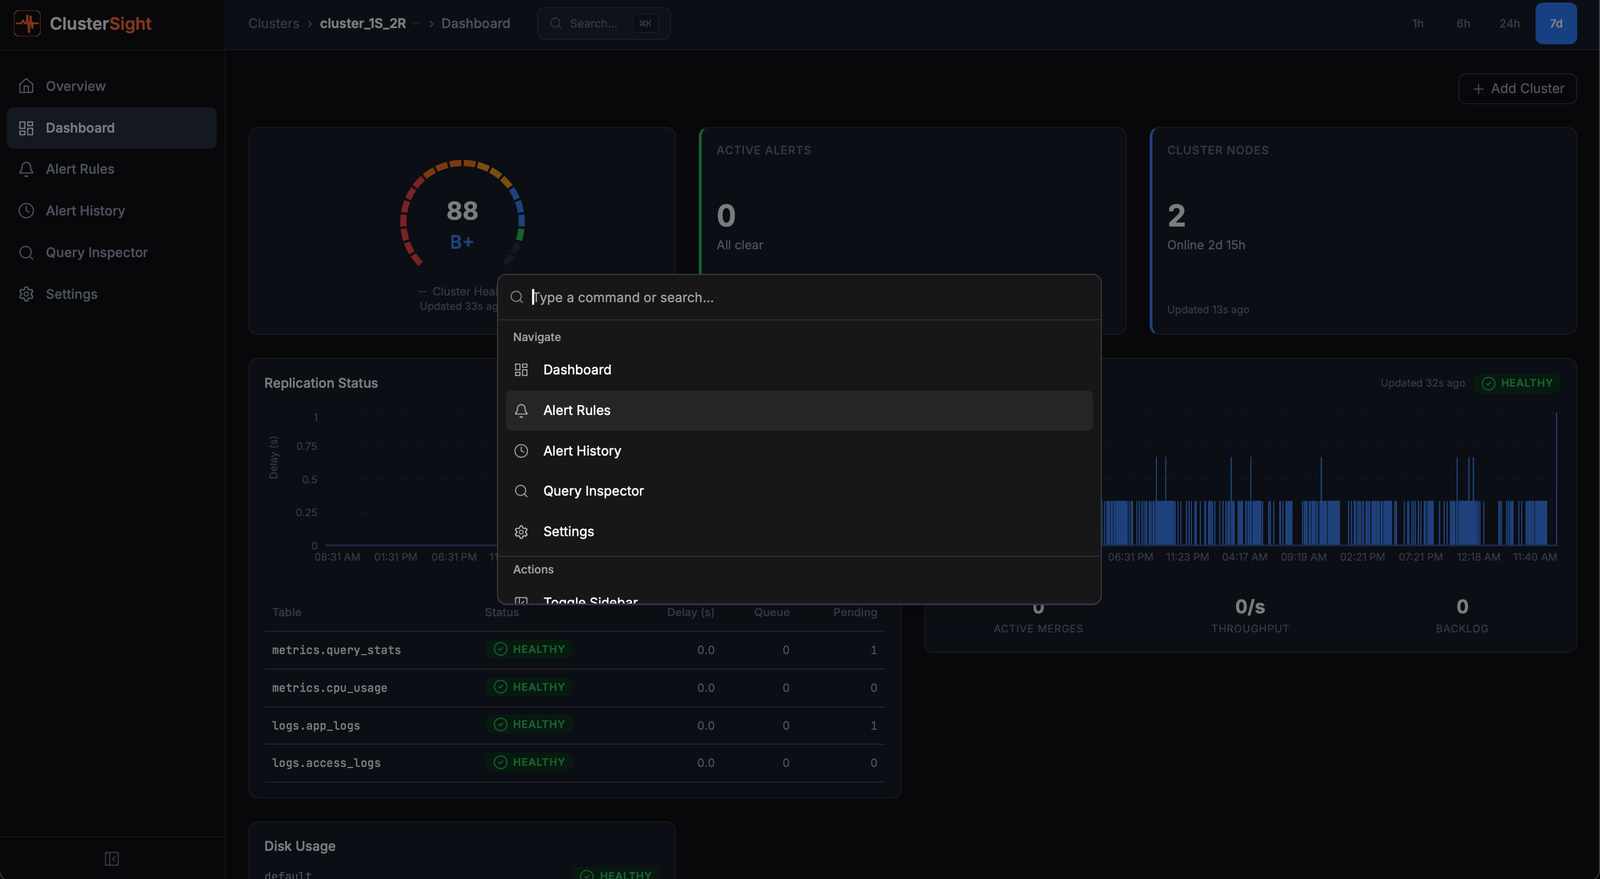
Command Palette
The command palette provides keyboard-driven navigation to any page in ClusterSight.
Opening the palette
Press Cmd+K (macOS) or Ctrl+K (Windows/Linux) from anywhere in the app.
Available actions
Cluster-scoped (only shown when viewing a specific cluster):
| Action | Navigates to |
|---|---|
| Dashboard | Cluster dashboard with all 11 panels |
| Alert Rules | Alert rules management page |
| Alert History | Historical alert log with filters |
| Query Inspector | Slow queries, failed queries, parts distribution |
Global (always available):
| Action | Navigates to |
|---|---|
| Settings | Application settings (Slack webhook, collection interval) |
The palette also surfaces recently visited pages for quick re-navigation.
Searching
Type to filter the action list. The palette performs fuzzy matching on action names.