ClickHouse observability that tells you what to fix, not just what's broken.
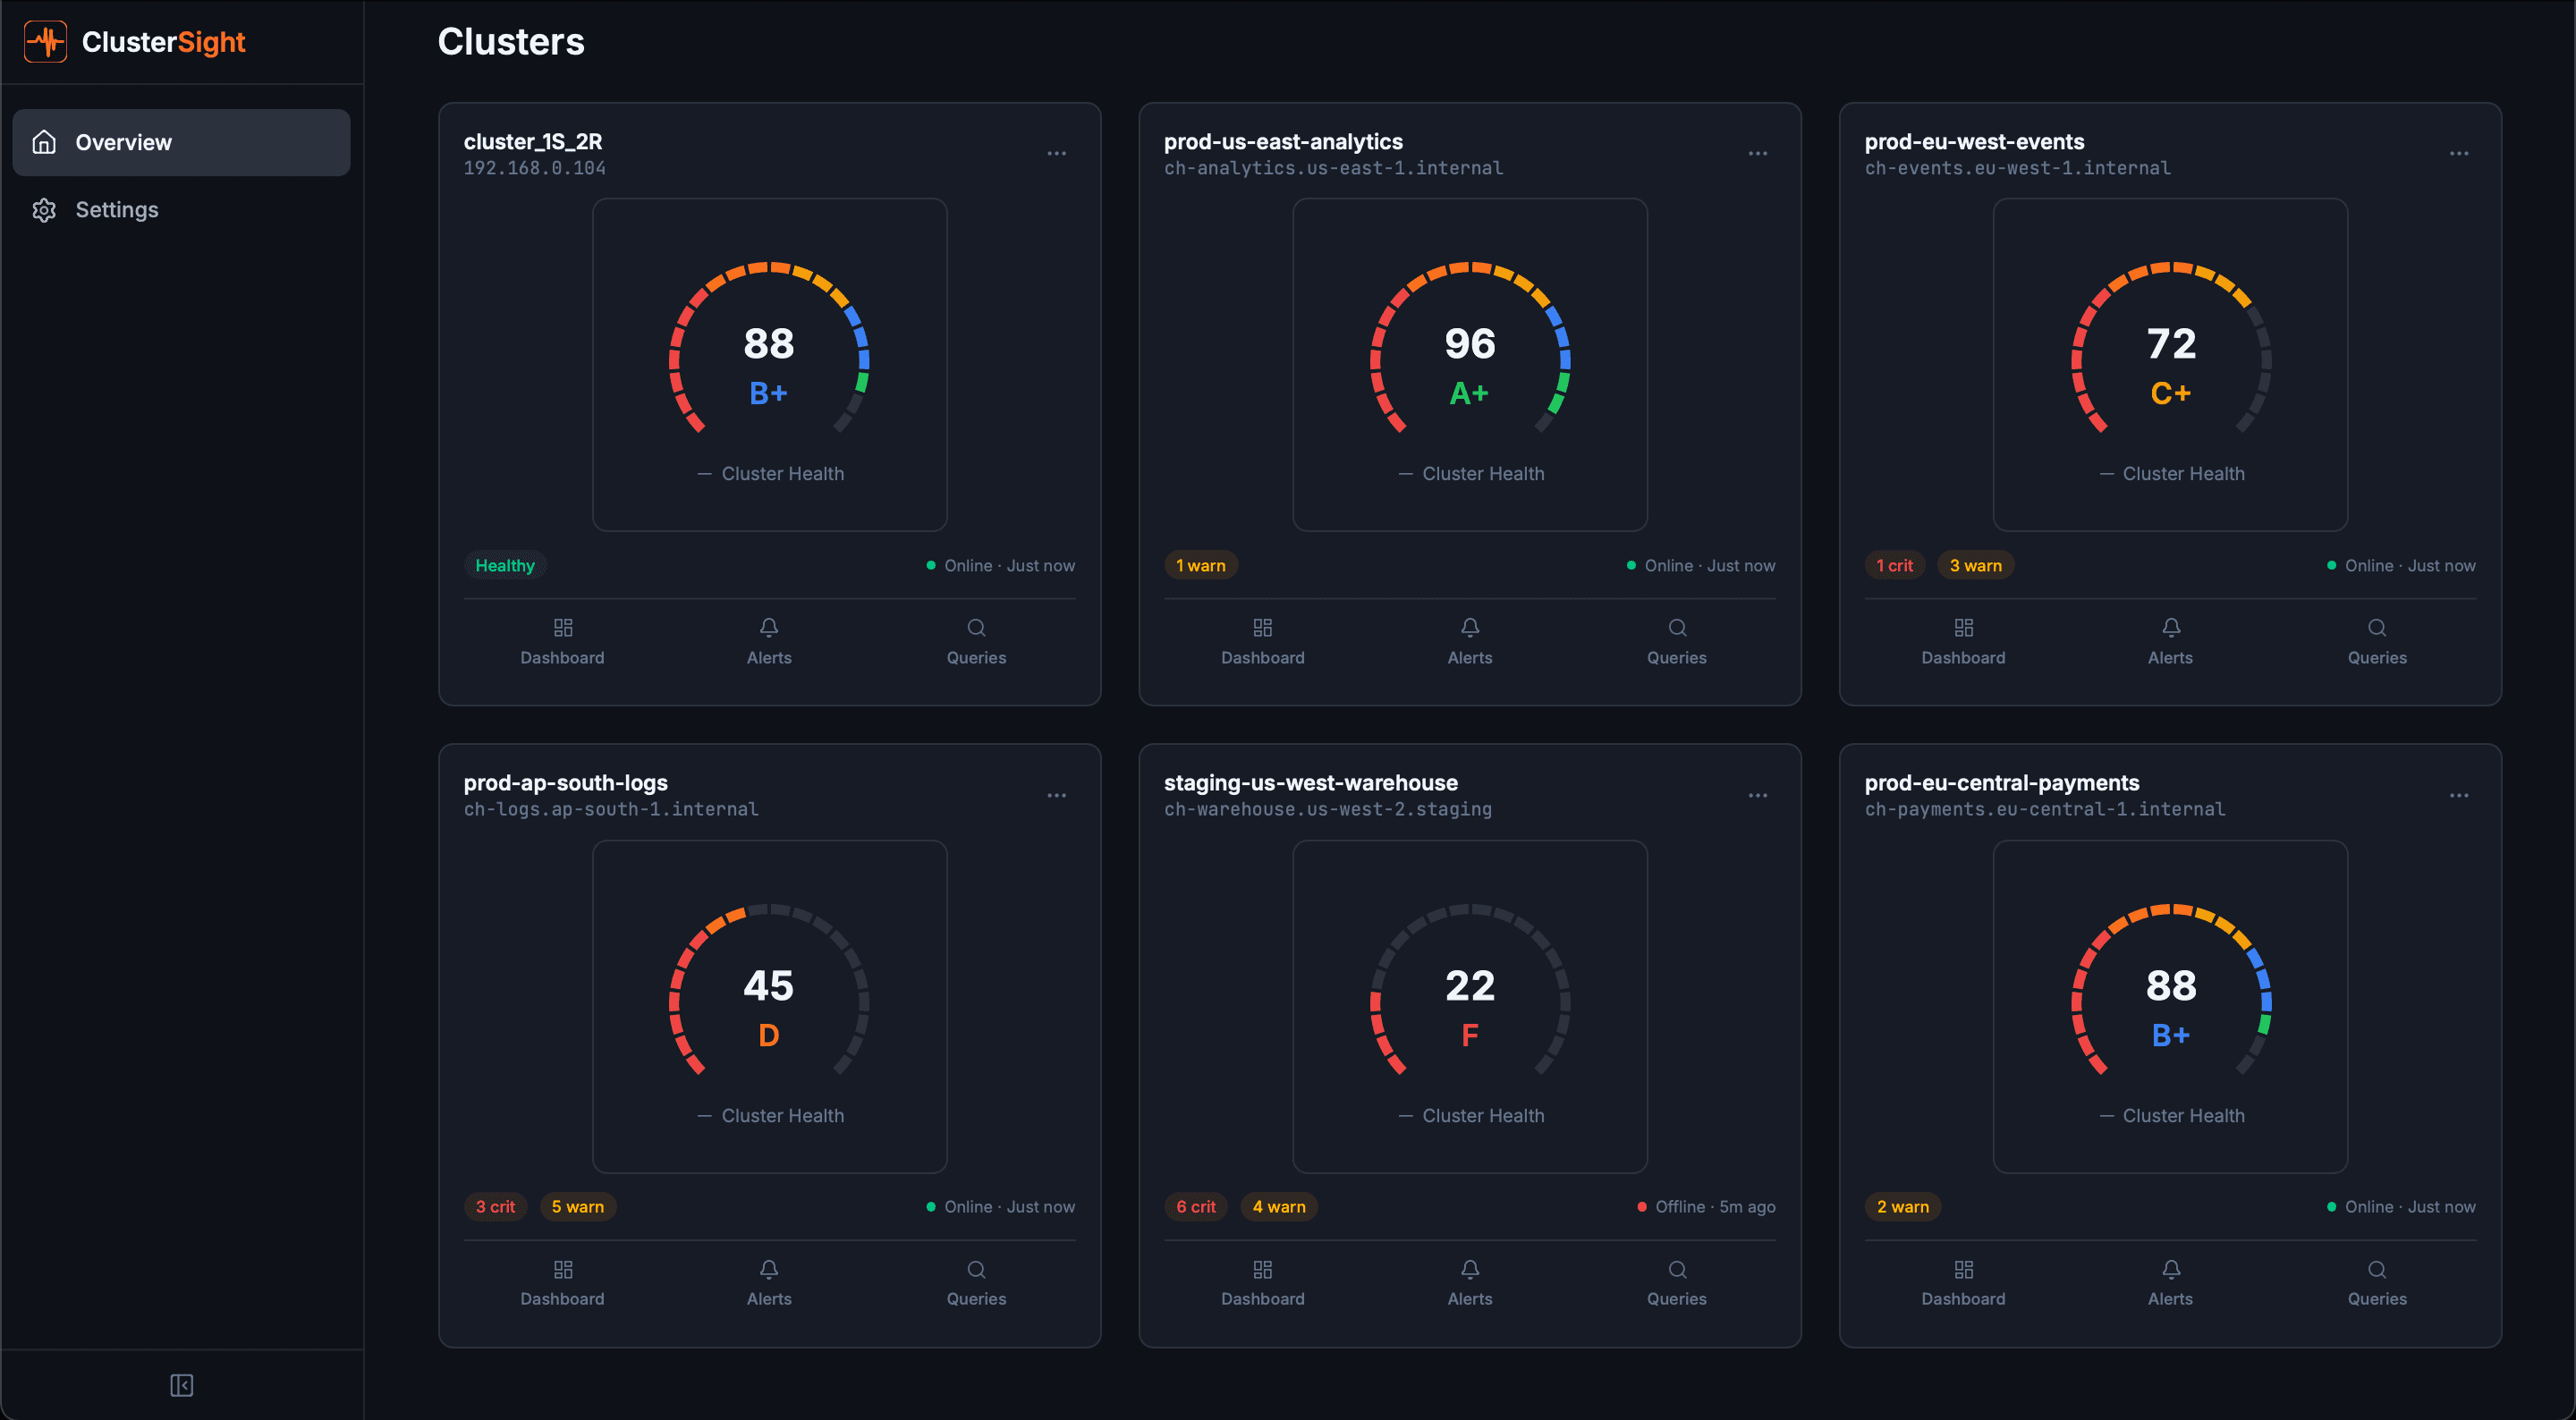
A single health score for your entire ClickHouse cluster. When something breaks, you get the alert and the SQL fix command — not a wall of graphs.
Trusted by ClickHouse teams at forward-thinking companies
You're flying blind on 70% of your ClickHouse metrics.
Standard tools like Grafana only surface surface-level metrics. ClusterSight exposes the hidden operational layer — broken parts, mutation backlogs, ZooKeeper lag — the metrics that actually predict failures.
Tool Fragmentation
4–6 tools to get basic ClickHouse visibility. ClusterSight replaces all of them.
The Hidden 70%
400+ operational metrics that Grafana and DataDog simply never surface.
No Fix Guidance
Standard alerts tell you something is wrong. ClusterSight tells you the SQL to run.
Every alert ships with a fix.
No more Googling. No more guessing. One click to copy the SQL.
Replication lag detected
database.events_table is 47 minutes behind replica
Your ClickHouse cluster is talking. Are you listening?
Deploy ClusterSight in under 8 minutes. Free for one cluster.